Intraview
|
7
• follow a gradual cleaning schedule during a full
operational system by adding Intra Hydrocare via
a dosage pump to the water until acceptable RLU
values are reached. RLU’s have been measured
every 10 days. Additionally, Hydrocare strips can
confirm how much effect Intra Hydrocare has had
in the complete system.
• follow a maintenance schedule, by lowering the
Intra Hydrocare dosage.This to a level that the
water remained suitable for animals to drink and
milk yeald remained at the proper level.
Table 1.Water quality values in Relative Light Units (RLUs) and their definition.
Water quality improvement during the trial
The quality of the incoming water was at 10 RLU,
which is “human grade”. Every 10 days the RLU’s
have been measured.The measurements were done
just before the trial started, and during the first
3 months, displayed in table 2:
Table 2: RLU measurements at several point on a monthly interval
After cleaning the tank, the water quality in the tank
directly turned to a human grade level (meaning <70
RLU) and was in line with the level of the incoming
water.The gradual cleaning schedule with Intra
Hydrocare moved the RLU to levels below 300 RLU,
meaning the water quality in the entire system had
become suitable to drink.These levels are low, taking
in consideration that the calves, heifers and cows
constantly are polluting the water by mucus and
feeding residues.
The effect of clean drinking water on milk
and farm performance
All parameters at the Dairy Academy are
administrated daily administrated via CowVIsion
monitoring system.Table 3 compares the current year,
based on Intra Hydrocare, with the previous year.
The dairy academy Oenkerk actually has a larger
herd size.The growth of this farm was realized by a
lower number of young stock needed per 10 dairy
cows and less days of dry off.The average daily
milk yield had improved by 1.3 kg milk per cow.
The protein level increased almost immediately.The
improvement of the potein level, with an average of
0.19%, together with 0.3 points lower urea level, are
strong indicators for better protein utilization.The
decrease of calf mortality , pre weaning, gives a good
indication of what water can mean for an improved
health condition.
Measurements in
RLU:
Before
cleaning
After 1
month
After 2
months
After 3
months
water tank
2.166
2
1
7
drinking bowls calves
2.737 712
168
175
troughs dry cows
1.395 605
85
53
troughs lactation cows 1.185 218
68
23
troughs heifers
1.544 585
273
100
RLU value with Intra
Quick Scan
Definition
<70
Suitable for human
consumption
<300
Suitable for animal
consumption
300 - 500
Monitoring advised
500 - 1000
Action required
>1000
Immediate action required
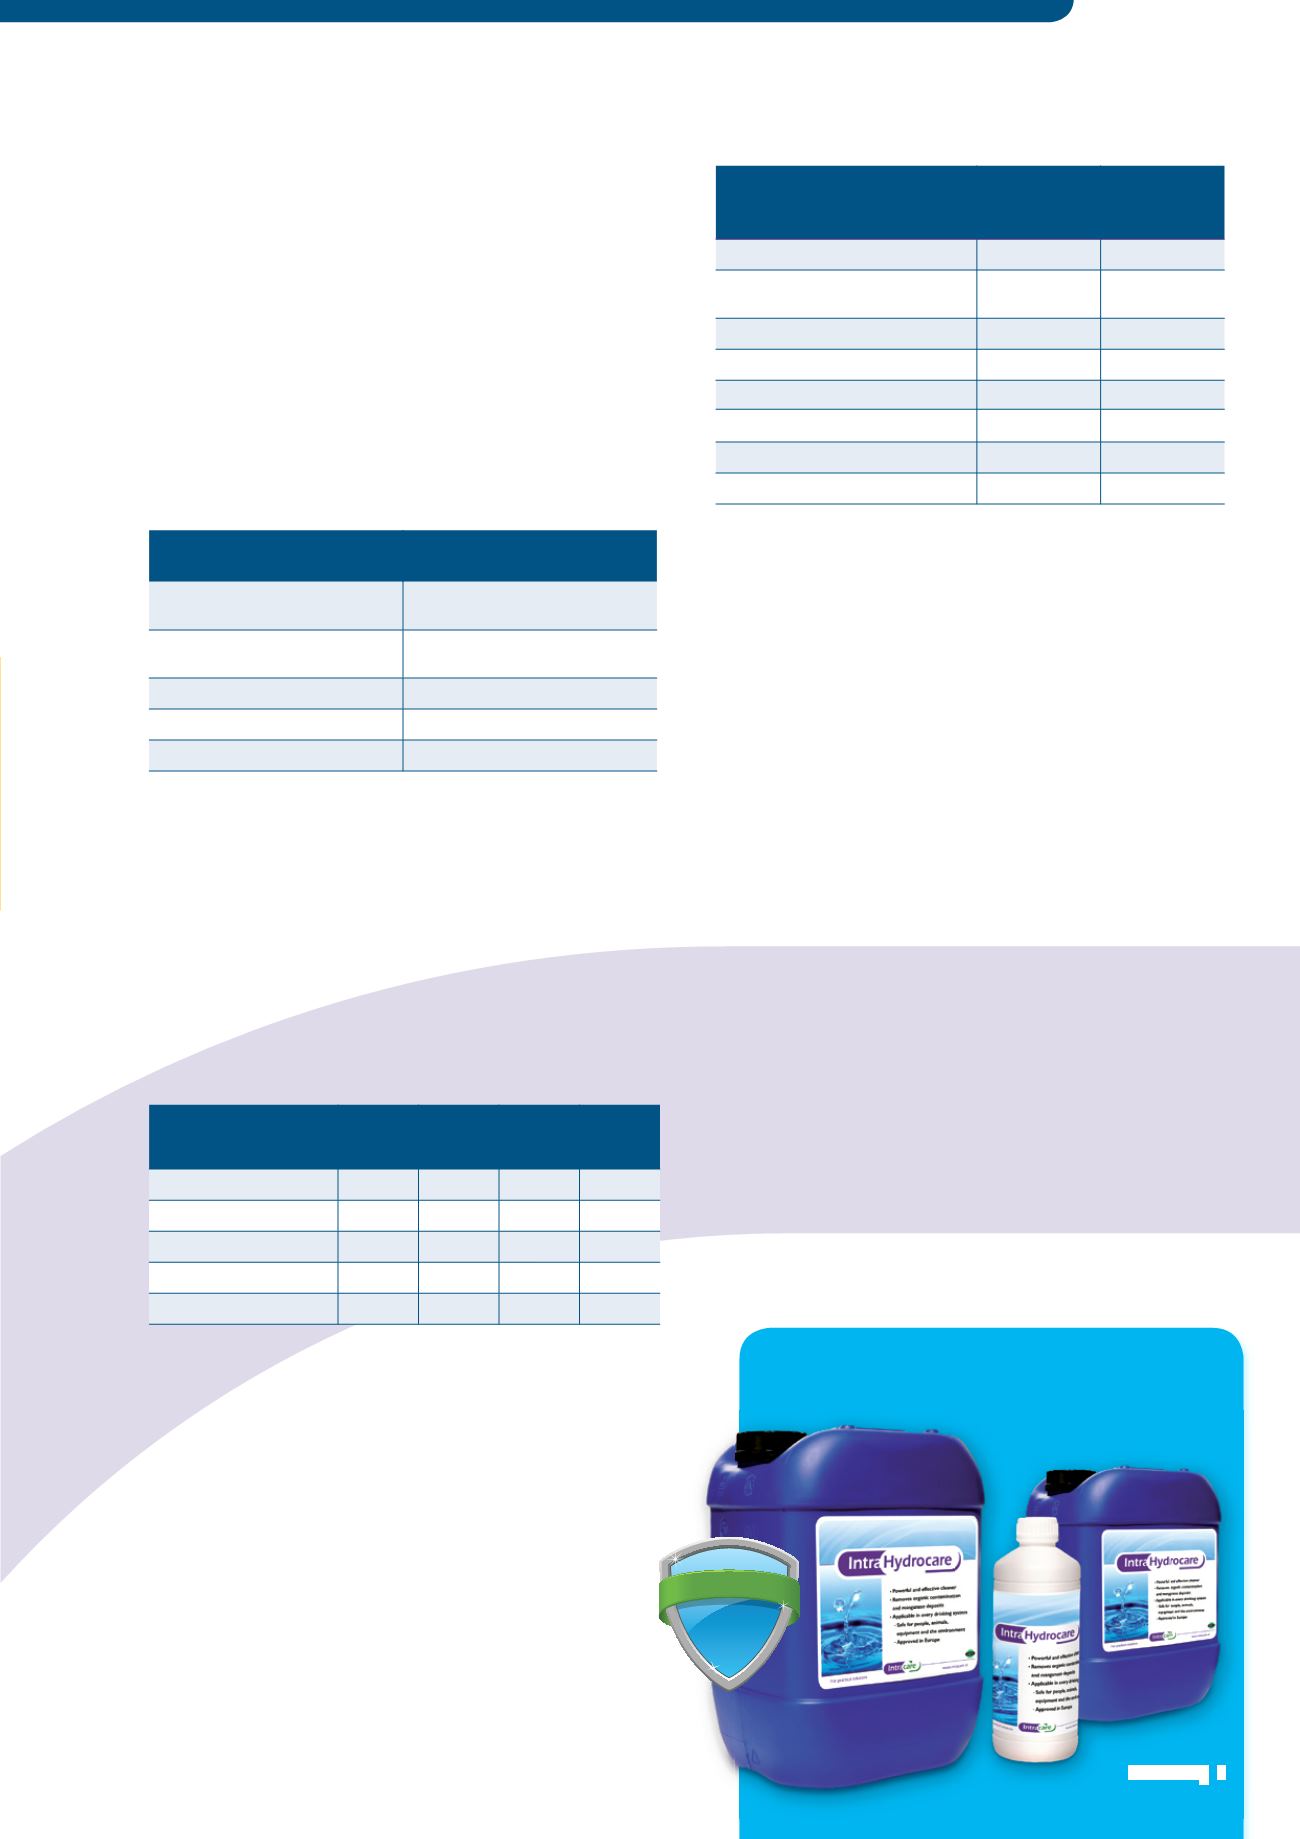
Product IntraHydrocare
B
e
s
t
r
e
g
i
s
t
e
r
e
d
d
i
s
i
n
f
e
c
t
i
n
g
P
r
i
v
a
t
e
a
r
e
a
a
n
d
P
u
b
l
i
c
h
e
a
l
t
h
P
T
0
2
P
T
0
3
P
T
0
4
P
T
0
5
V
e
t
e
r
i
n
a
r
y
H
y
g
i
e
n
e
F
o
o
d
a
n
d
F
e
e
d
D
r
i
n
k
i
n
g
w
a
t
e
r
a
n
d
s
a
n
i
t
i
z
i
n
g
p
r
o
d
u
c
t
Last year
29-10-2014 /
28-10-2015
Current year
29-10-2015 /
28-10-2016
Ave. number of cows
165
188
Number young stock/10 dairy
cows
8,8
6,4
Ave. kg milk/cow/cay
29,3
30,6
Protein content
3,43%
3,62%
Ureum
2,7
2,4
Fat content
4,19%
4,23%
Ave. number of days dry off
54
42
Calf mortality day 2 thru 60
6,5%
3,0%


